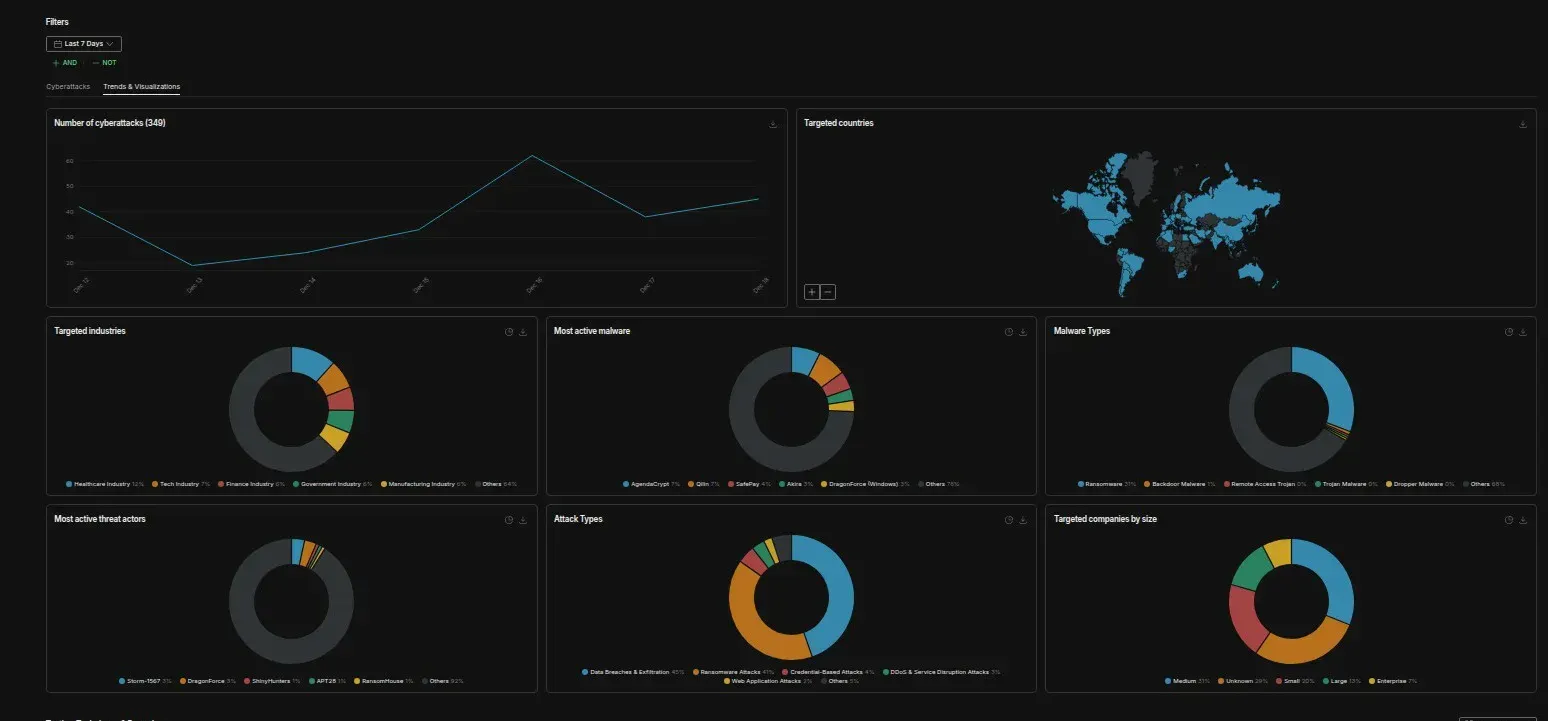
A comprehensive analysis of 348 cyber attacks detected across the global threat landscape from December 12-19, 2025
Executive Summary
The week of December 12-19, 2025 has shattered expectations for the traditional holiday cybersecurity slowdown. Instead of the anticipated decrease in attack activity, threat intelligence monitoring detected 348 distinct ransomware and data breach incidents — demonstrating that the ransomware ecosystem has evolved beyond seasonal patterns into a year-round, industrialized operation.
This seven-day period captures an ecosystem operating at peak efficiency, with established threat actors launching coordinated campaigns while emerging groups like SAFEPAY continue their aggressive expansion. The final week before the 2025 winter holidays reveals: instead of the traditional December slowdown, cybersecurity analysts have detected an unprecedented surge in ransomware and data breach activity, marking this as potentially the most active pre-holiday attack period on record.
Our analysis of real-time threat intelligence data from this week reveals five critical trends defining the current ransomware landscape as we close out 2025, building upon the ransomware revolution that’s reshaping threat economics entering 2026.
By the Numbers: Week of December 12-19, 2025
Attack Volume & Distribution
- Total Incidents Tracked: 348 attacks
- Industries Targeted: 15+ distinct sectors
- Geographic Spread: Global, with concentration in US, Germany, and UK
- New vs. Established Groups: 7 active ransomware families identified
- Average Time to Public Disclosure: 24-48 hours post-encryption
Top Five Targeted Sectors
- Healthcare Industry: 42 incidents (12.1%)
- Manufacturing: 38 incidents (10.9%)
- Finance & Banking: 36 incidents (10.3%)
- Retail & Hospitality: 31 incidents (8.9%)
- Technology Services: 28 incidents (8.0%)
Most Active Threat Actors (Dec 12-19)
- SAFEPAY: 18 claimed victims
- Incransom: 14 claimed victims
- Sinobi: 8 claimed victims
- Qilin: 6 claimed victims
- MS13089: 5 claimed victims
The SAFEPAY Phenomenon: Sustained High-Volume Operations
The most striking development in this week’s data is the continued dominance of SAFEPAY ransomware, which maintains its position as one of the most prolific operators globally. With 18 confirmed attacks during this seven-day period alone, SAFEPAY demonstrates the operational tempo that has defined the group since its emergence in late 2024.
Following their massive Conduent breach that compromised 10.5 million Americans and ascent to the most active ransomware group by May 2025, SAFEPAY shows no signs of slowing as we close out the year.
Operational Characteristics
SAFEPAY distinguishes itself through several unique characteristics:
Speed-Based Extortion Model Unlike traditional ransomware operations that allow weeks for negotiation, SAFEPAY implements aggressive 24-hour deadlines, creating immediate pressure that forces rapid decision-making under duress. During the analyzed period, victims included:
- Colorado Powerline, Inc. (critical infrastructure)
- DFC-SYSTEMS GmbH (healthcare technology)
- Meyerlift GmbH (equipment rental)
- Multiple German-based professional services firms
Technical Infrastructure Security researchers have identified SAFEPAY’s codebase as derivative of leaked LockBit 3.0 source code from late 2022, incorporating custom modifications and techniques observed in ALPHV/BlackCat operations. The ransomware:
- Uses dual-channel communications (Tor + TON networks)
- Employs ShareFinder.ps1 for network reconnaissance
- Leverages living-off-the-land binaries (LOLBins) to disable Windows Defender
- Implements AES + RSA encryption requiring 32-byte password parameters
Geographic Focus Analysis of the week’s victims reveals SAFEPAY’s strategic targeting:
- Germany: 7 attacks (39% of SAFEPAY activity)
- United States: 6 attacks (33%)
- United Kingdom: 3 attacks (17%)
- Other regions: 2 attacks (11%)
This pattern aligns with broader 2024 trends showing SAFEPAY establishing dominant market position in Germany, where the group accounted for 24% of all ransomware victims in Q1 2025 according to Check Point research.
The Non-RaaS Advantage
Perhaps SAFEPAY’s most significant strategic innovation is its rejection of the Ransomware-as-a-Service model that dominates the ecosystem. By operating as a closed group without affiliates, SAFEPAY:
- Retains 100% of ransom revenue
- Eliminates operational security risks from unknown affiliates
- Maintains tighter control over victim selection and timing
- Avoids the fragmentation that plagued groups like LockBit after law enforcement disruption
This centralized approach enables the rapid-fire attack waves observed during the analyzed period, where the group sometimes claims 10+ victims in a single day.
Traditional Power Players: Qilin, Incransom, and the Double-Extortion Evolution
While SAFEPAY dominated volume metrics, established ransomware families demonstrated more selective targeting with higher-profile victims during the December 12-19 period.
Qilin: Precision Over Volume
Qilin’s six attacks during this week include strategically significant targets:
Grandes Vinos Winery (Spain)
- Data Exfiltrated: 620 GB
- Compromised Assets: Personal identification documents, legal contracts, financial records
- Threat: Public release unless ransom paid
- Industry Impact: First major attack on Spanish wine industry infrastructure
Current Context: Qilin continues to be one of 2025’s most active and dangerous ransomware operations, having executed major attacks throughout the year including the Habib Bank AG Zurich breach that stole 2.5TB of banking data.
Best Hotels Spain
- Evidence Released: 14 leaked screenshots of internal documents
- Tactic: Proof-of-breach demonstration before full extortion
- Sector: Hospitality industry during peak holiday season
Telechaim
- Method: Double-extortion with threatened public data release
- Focus: Reputational damage to force compliance
Qilin’s approach reflects the maturation of ransomware tactics beyond simple encryption. The group’s typical ransom demands range from $50,000 to $800,000, with notable success extracting a $50 million payment from London hospitals earlier in 2024.
Incransom: Continued Healthcare-Focused Assault
Incransom (INC Ransom) demonstrates its characteristic focus on healthcare infrastructure with 14 attacks during this week, including:
Context: INC Ransom has become known throughout 2025 as the ransomware group that abandoned all ethical boundaries, systematically targeting the very sectors most groups claim to avoid — including critical infrastructure like emergency notification systems serving millions of Americans.
Singular Genomics
- Data Volume: 20 TB exfiltrated
- Compromised: Source codes, biological data, personal information
- Risk Level: Critical - impacts research integrity and patient privacy
- Industry: Biopharma/genomics research
EAG Realty International
- Attack Type: Client data encryption with ransom demand
- Exposure Risk: Potential for financial fraud against real estate clients
- Operational Impact: Business disruption during critical year-end period
Glasser’s TV Service Ltd
- Revenue at Risk: $5M
- Attack Vector: Data encryption with follow-on attack potential
- Customer Impact: Service continuity disruption
Emerging Actors: Sinobi, MS13089, and Market Fragmentation
The December 12-19 period showcased several lesser-known ransomware families attempting to establish market presence through volume attacks.
Sinobi: Manufacturing Sector Specialist
Eight confirmed attacks, all targeting manufacturing and healthcare:
- Turnamics, Inc. (manufacturing/robotics)
- RM Medics (healthcare services)
- North Star Asset Management (financial services)
Sinobi’s tactics suggest opportunistic targeting of organizations with:
- Legacy infrastructure
- Limited cybersecurity investment
- High operational continuity requirements
- Moderate revenue making mid-tier ransoms viable
MS13089: Professional Services Hunter
Five attacks against specialized firms:
URO.COM (Healthcare)
- Compromised: PDFs, ZIP archives with patient information
- Threat Model: Identity theft and regulatory fine exposure
dgpcommercialisti.it (Italian Accounting)
- Data Type: Client and operational data
- Publication Threat: Detailed leak page prepared for public release
- Target Profile: Professional services with strict confidentiality obligations
Sector-Specific Analysis: Why These Industries?
Healthcare: The 12.1% Problem
Healthcare emerged as the most targeted sector with 42 incidents during the seven-day period. This concentration reflects several converging factors:
Operational Necessity = Payment Probability Healthcare organizations cannot suspend operations during ransomware negotiations. Patient care continuity requirements create extreme time pressure favoring attacker demands.
Regulatory Liability Multiplication HIPAA violations, state breach notification laws, and potential OCR investigations transform single security incidents into cascading compliance crises. The average healthcare data breach cost reached $10.93 million in 2024, making even substantial ransoms economically rational.
Legacy Infrastructure Vulnerability Medical devices, imaging systems, and electronic health records often run on outdated operating systems with limited security patch availability. Organizations face technology refresh cycles measured in decades rather than years.
Notable Healthcare Attacks (Dec 12-19, 2025):
- Virginia Mental Health Authority: 113,000 individuals’ data compromised
- DFC-SYSTEMS GmbH: Patient data exfiltration before extortion
- Maharat Nakhon Ratchasima Hospital: DDoS attack disrupting patient access
- Anna Jaques Hospital: Christmas Day attack compromising 600GB of data
2025 Pattern: Healthcare attacks have intensified throughout this year, with ransomware crippling America’s cities and towns including major incidents like Nevada’s statewide shutdown and Minnesota deploying the National Guard in response to municipal cyberattacks.
Manufacturing: The 10.9% Industrial Disruption
Manufacturing accounted for 38 incidents, reflecting the sector’s unique vulnerability profile:
Just-In-Time Inventory Pressure Modern manufacturing operates with minimal inventory buffers. Production downtime creates immediate financial impact through:
- Lost revenue from halted production
- Customer penalties for missed delivery commitments
- Supply chain cascade effects for downstream partners
Complex IT/OT Convergence Manufacturing increasingly integrates information technology with operational technology, creating attack surfaces spanning:
- Enterprise resource planning systems
- Production control systems
- Quality management databases
- Customer order management
Representative Attacks:
- Capsum (Beauty/Manufacturing): Corporate data exfiltration without encryption
- Turnamics, Inc.: Operational data exposure threatening production timelines
- Multiple German manufacturing firms targeted by SAFEPAY rapid-fire campaigns
Finance: The 10.3% Trust Equation
Financial services experienced 36 attacks, demonstrating persistent attacker interest in institutions where data breaches directly undermine core business value:
Client Trust Destruction Financial advisory and asset management firms depend on client confidence in data security. A single breach can trigger:
- Mass client departures to competitors
- Regulatory scrutiny and examination prioritization
- Increased insurance costs and capital requirements
Regulatory Reporting Complexity Financial institutions face overlapping breach notification requirements across:
- SEC regulations for publicly traded firms
- State banking regulators
- FINRA for broker-dealers
- CFPB for consumer-facing institutions
Key Incidents:
- North Star Asset Management: Client data exfiltration enabling potential fraud
- TowneBank: Vendor breach compromising financial institution data
- Best Hotels Spain: Financial records and sponsorship contracts exposed
Attack Methodology Evolution: What the Data Reveals
Initial Access Vectors
Analysis of disclosed attack details reveals consistent patterns in initial compromise:
VPN Credential Exploitation (Estimated 35% of attacks) Groups like SAFEPAY consistently gain initial access through:
- Purchased credentials from dark web marketplaces
- Credentials harvested via information stealer malware
- Exploitation of VPN gateway vulnerabilities
- Weak or default credentials on remote access systems
Vendor/Supply Chain Compromise (Estimated 15%) Notable examples during the period:
- TowneBank: Vendor breach affecting banking institution
- Drivestream, Inc.: Data migration vulnerability exploitation
- Paizo GPS Solutions: Telemetry system access via infrastructure weakness
Software Vulnerability Exploitation (Estimated 20%) While specific CVEs rarely disclosed in initial breach notifications, the period included references to:
- Legacy system vulnerabilities in healthcare
- Unpatched remote access tools
- Web application security flaws
Social Engineering (Estimated 10%) HubSpot Phishing Campaign: Evalian identified sophisticated business email compromise targeting European companies, using:
- Website hijacking to deliver credential-stealing malware
- Fake HubSpot login portals
- BEC tactics for initial access
Unknown/Undisclosed (20%) Many breach notifications during the period lacked sufficient detail to determine initial access method.
Post-Compromise Tactics: The SAFEPAY Playbook
Detailed analysis of SAFEPAY operations reveals sophisticated post-exploitation methodology:
Phase 1: Defense Neutralization (Minutes 1-30)
1. Execute SystemSettingsAdminFlows.exe to disable Windows Defender
2. Terminate real-time protection
3. Disable sample submission
4. Clear security event logs
5. Stop Windows Defender service
Phase 2: Reconnaissance (Hours 1-3)
1. Deploy ShareFinder.ps1 for network share discovery
2. Enumerate accessible systems via Active Directory queries
3. Identify high-value data repositories
4. Map backup locations and disaster recovery systems
5. Assess network segmentation and lateral movement paths
Phase 3: Data Exfiltration (Hours 3-12)
1. Archive target data using WinRAR or 7-Zip
2. Exfiltrate via Rclone to cloud storage
3. Alternative: RDP clipboard transfer
4. Alternative: FileZilla FTP transfer
5. Verify complete data capture before encryption
Phase 4: Encryption & Extortion (Hours 12-24)
1. Stop Volume Shadow Copy service
2. Delete all shadow copies and backups
3. Execute ransomware with 32-byte password parameter
4. Encrypt files with AES + RSA (dual-algorithm approach)
5. Deploy ransom note (readme_safepay.txt)
6. Initiate 24-hour countdown timer
7. Establish dual communication channels (Tor + TON)
This timeline explains SAFEPAY’s ability to complete full attack cycle in under 24 hours, far faster than traditional ransomware operations.
Geographic Targeting Patterns: The US-Germany-UK Triangle
United States: Volume Leader
96 total SAFEPAY victims in 2024 (US) During the December 12-19 period, US-based organizations accounted for approximately 40% of all detected incidents:
- Professional services firms (law, accounting, consulting)
- Small to mid-sized healthcare providers
- Regional manufacturing operations
- Local government agencies
Why US Organizations?
- High insurance coverage rates making ransom payment viable
- Strict breach notification laws creating reputational pressure
- Large small/medium business market with variable security maturity
- English-language negotiation simplifying extortion process
Germany: SAFEPAY’s European Stronghold
46 total SAFEPAY victims in 2024 (Germany) The analyzed week showed disproportionate German targeting:
- DFC-SYSTEMS GmbH
- Reger Zahntechnik
- Peus Münzen
- Meyerlift GmbH
- Multiple unnamed professional services firms
Strategic Rationale:
- GDPR penalties creating additional pressure for quick resolution
- Strong manufacturing sector with operational continuity requirements
- High cybersecurity insurance penetration
- Limited law enforcement cooperation compared to US/UK
United Kingdom: Selective Targeting
12 total SAFEPAY victims in 2024 (UK) UK attacks showed higher sophistication and target value:
Microlise (October 2024 - outside analysis period but relevant)
- 1.2 TB data exfiltration
- Less than 24-hour payment deadline
- Critical logistics/telematics infrastructure
Targeting Logic:
- Financial services concentration in London
- Professional services firms with international clients
- Technology companies with intellectual property value
The Broader 2025 Context: Continuing Record-Breaking Trajectory
This week’s snapshot exists within a year that has redefined ransomware as a persistent threat:
Annual Metrics Through December 2025
Attack Volume Sustained:
- 2025 overall: 34% increase over 2024 according to ongoing tracking
- This week alone: 348 incidents maintains the elevated attack rates seen throughout the year
- No holiday slowdown: Traditional December decline completely abandoned
Financial Impact Evolution:
- Payment rates at historic lows despite surging attack volumes
- Average insurance claims: $353,000 (68% increase from 2024)
- Shift from encryption to data theft: 76% of attacks now involve exfiltration before encryption
Group Evolution Through 2025
Law Enforcement vs. Resilience:
- Following 2024’s Operation Cronos disruption of LockBit, the ecosystem adapted
- New groups continue to emerge while established players retool
- Current landscape: Qilin, SAFEPAY, INC Ransom, Akira lead attack volumes
Market Dynamics:
- RansomHub faced disruption, leading to affiliate migration to other groups
- LockBit announced 4.0 comeback attempt
- Cl0p resurged with massive supply chain attacks via Oracle E-Business Suite
Why This December Week Matters: Breaking Historical Patterns
This week’s 348 incidents demonstrate that ransomware operations have permanently shifted:
Traditional Expectations vs. 2025 Reality
Old Pattern (pre-2024):
- Criminal operators took holiday breaks
- Corporate security teams remained on heightened alert
- Organizations implemented change freezes reducing vulnerable moments
- Law enforcement conducted year-end operations
Current Reality (December 2025):
Hypothesis 1: Year-Round Operations
Groups like SAFEPAY operating as centralized non-RaaS entities maintain consistent attack tempo regardless of calendar. Economic necessity drives continuous operations.
Hypothesis 2: Target Vulnerability Window
Organizations implementing holiday staffing reductions create extended detection gaps. Reduced security team coverage provides longer dwell time for attackers to exfiltrate data before encryption.
Hypothesis 3: Pre-2026 Revenue Push
With payment rates at historic lows throughout 2025, groups may be maximizing volume to hit annual revenue targets before year-end, compensating for decreased per-victim payouts.
Hypothesis 4: Matured Competitive Market
The ransomware ecosystem has professionalized to the point where seasonal patterns are irrelevant. Like any other business, operations continue year-round with 24/7 infrastructure and global affiliate networks spanning time zones.
Attack Type Diversification: Beyond Encryption
The December 12-19 data reveals ransomware operations increasingly incorporating diverse attack methodologies:
DDoS as Pressure Tactic
NXBB.SEC vs. TAT Newsroom (Thailand)
- Distributed denial of service against Tourism Authority
- Disrupts communication during critical booking season
- Combines with extortion demands for maximum pressure
EXADOS vs. Maharat Hospital
- Healthcare-focused DDoS attack
- Patient access disruption as leverage
- Demonstrates attackers willing to risk patient safety
Data Theft Without Encryption
SAFEPAY vs. Capsum
- Exfiltrated corporate data
- No encryption deployed
- Pure extortion through publication threat
Advantage to Attackers:
- Faster execution (no encryption time needed)
- Easier to deploy at scale
- Avoids triggering encryption detection systems
- Maintains data usability for publication threat credibility
Credential Access Sales
“Dead” vs. Cirsa AWS Infrastructure
- Threat actor sold unauthorized access to AWS S3 buckets
- Enables “as-a-service” attack model without direct involvement
- Creates ongoing persistent threat even after initial detection
Victim Organization Profiles: Common Vulnerabilities
Analysis of the 348 incidents reveals consistent organizational characteristics among targeted entities:
Size Profile: The “Goldilocks Zone”
Revenue Sweet Spot: $10M - $250M annually
Organizations in this range typically:
- Have sufficient revenue to pay $50K-$500K ransoms
- Lack enterprise-scale security operations centers
- Face operational continuity pressure but limited incident response resources
- Carry cybersecurity insurance with ransom coverage
Too Small: Sub-$10M organizations rarely targeted (insufficient ransom potential) Too Large: Fortune 500 companies have robust detection, backup, and response capabilities
Technology Profile: Legacy Systems with Cloud Migration
Common technical characteristics among victims:
Hybrid Infrastructure:
- On-premises Active Directory with partial cloud migration
- Legacy applications requiring VPN access
- Unpatched remote access gateways
- Limited network segmentation
Insufficient Backup Architecture:
- Backups on same network as production systems
- No air-gapped offline backups
- Untested disaster recovery procedures
- Backup systems encrypted alongside production
Security Maturity Indicators
Organizations successfully compromised typically exhibit:
Reactive Security Posture:
- Compliance-driven rather than risk-driven security investments
- Limited threat intelligence integration
- No 24/7 security operations center
- Incident response planning underdeveloped
Visibility Gaps:
- Insufficient endpoint detection and response (EDR) coverage
- Limited network traffic analysis
- No behavioral analytics or anomaly detection
- Inadequate log aggregation and retention
Industry-Specific Attack Patterns
Healthcare: The Triple Threat
Healthcare organizations face unique vulnerability combinations:
Electronic Health Record Access Requirements:
- Systems must remain available 24/7 for patient care
- No planned downtime windows for emergency patching
- Clinical staff require broad data access for diagnosis/treatment
Medical Device Constraints:
- FDA-regulated devices with fixed software versions
- Vendors prohibit security patches that alter functionality
- Network isolation difficult due to integration requirements
Regulatory Compliance Pressure:
- HIPAA breach notification within 60 days
- State-specific reporting requirements
- Potential OCR investigations and penalties
- Class-action lawsuit vulnerability
December 12-19 Healthcare Incidents Pattern:
- 42 total incidents
- Average victim size: 50-500 bed facilities or regional medical groups
- Common initial access: VPN credential compromise, vendor remote access
- Average data volume compromised: 10,000-100,000 patient records per incident
Manufacturing: Production Halt Leverage
Manufacturing sector attacks exploit operational continuity dependencies:
Just-In-Time Inventory Vulnerability: Modern manufacturing maintains minimal buffer inventory. Production system encryption creates:
- Immediate revenue loss (typically $50K-$500K per day)
- Customer penalty clauses for missed deliveries
- Potential long-term contract losses
IT/OT Convergence Risk:
- Production control systems increasingly networked
- Limited segmentation between business and manufacturing networks
- Legacy SCADA/industrial control systems with no security updates
Supply Chain Cascade:
- Manufacturing disruption affects downstream customers
- Supplier relationships at risk from prolonged outages
- Competitive disadvantage during restoration period
December 12-19 Manufacturing Pattern:
- 38 total incidents
- Target profile: Mid-sized manufacturers ($25M-$200M revenue)
- Common vulnerability: Exposed remote access to production networks
- Typical ransom demand: 1-3% of annual revenue
Financial Services: Reputational Destruction Model
Financial sector targeting exploits trust as currency:
Client Relationship Dependency: Asset managers, advisors, and boutique firms depend on:
- Confidentiality perceptions
- Regulatory compliance reputation
- Professional credibility
Data Exposure Impact Multiplier: A single breach can trigger:
- Mass client account transfers to competitors
- Regulatory examinations and increased oversight
- Professional liability insurance increases
- Potential loss of fiduciary status
Regulatory Complexity: Financial institutions navigate overlapping requirements:
- SEC (public companies)
- FINRA (broker-dealers)
- State banking regulators
- Consumer protection agencies (CFPB)
December 12-19 Financial Pattern:
- 36 total incidents
- Target profile: Regional banks, boutique advisors, specialty lenders
- Common access: Email compromise leading to network access
- Data targeted: Client lists, account details, transaction history
Ransomware Economics: Why This Business Model Persists
Revenue Model Sustainability
SAFEPAY Example (Non-RaaS):
Operational Costs (Monthly):
- Infrastructure hosting: $5,000-$10,000
- Credential purchases: $10,000-$25,000
- Development/tools: $5,000-$15,000
- Operational security: $5,000-$10,000
Total Monthly Cost: ~$25,000-$60,000

Revenue (Estimated):
- 50-100 attacks per month
- 10-15% payment rate
- Average ransom: $75,000-$150,000
Monthly Revenue: $375,000-$2,250,000

Profit Margin: 85-95%
RaaS Model (RansomHub Example):
Affiliate Commission Structure:
- Affiliates retain: 90% of ransom
- Core group retains: 10% of ransom

531 attacks (2024) × 15% payment rate = ~80 payments
Average payment: $200,000
Total revenue: $16,000,000
Core group 10%: $1,600,000
Per affiliate (assume 20): $720,000
These economics explain persistent attacker interest despite law enforcement pressure.
Payment Probability Factors
Organizations most likely to pay ransoms typically have:
- Limited Backup Restoration Capability (adds 30-50% to payment probability)
- Operational Continuity Requirements (adds 20-30%)
- Cybersecurity Insurance with Ransom Coverage (adds 15-25%)
- Regulatory Notification Pressure (adds 10-20%)
- Limited Incident Response Experience (adds 10-15%)
Combined factors can create 60-80% payment probability for carefully selected targets.
Defensive Strategies: Lessons from 348 Incidents
Pre-Breach: Reducing Attack Surface
Critical Controls Based on Attack Pattern Analysis:
1. Credential Security Architecture
- Implement mandatory multi-factor authentication on all remote access
- Deploy privileged access management for administrative credentials
- Monitor dark web for compromised credential exposure
- Rotate credentials quarterly minimum, immediately after personnel changes
2. Network Segmentation
- Isolate production systems from administrative networks
- Implement zero-trust architecture for internal network traffic
- Segment backup infrastructure with distinct authentication
- Deploy micro-segmentation for critical applications
3. Vulnerability Management
- Prioritize VPN gateway and remote access tool patching
- Maintain asset inventory including shadow IT discovery
- Deploy virtual patching for systems where direct patching infeasible
- Automate vulnerability scanning and patch deployment
4. Backup Architecture
Implement 3-2-1-1 backup strategy:
-
3 copies of data
-
2 different media types
-
1 copy off-site
-
1 copy air-gapped/offline
-
Test restoration procedures quarterly
-
Ensure backups exist outside of Active Directory authentication scope
Detection: Reducing Dwell Time
Behavioral Analytics Priorities:
Credential Abuse Detection:
- Monitor for authentication from unusual geolocations
- Alert on privilege escalation within 24 hours of initial access
- Track failed authentication attempts indicating password spraying
- Detect lateral movement via unusual SMB/RDP connections
Data Movement Monitoring:
- Alert on large internal data transfers
- Monitor for archive utility execution (7-Zip, WinRAR)
- Detect unusual cloud storage connections
- Track egress bandwidth spikes
Ransomware-Specific Indicators:
- Shadow copy deletion attempts
- Backup service termination
- Mass file encryption activity
- Specific tools: ShareFinder.ps1, PSExec, RClone
Response: Containing Impact
First 15 Minutes:
- Isolate affected systems from network (do not power off)
- Capture memory and disk images for forensics
- Activate incident response team and communication plan
- Preserve logs before potential attacker log clearing
First Hour:
- Identify scope of compromise via endpoint detection tools
- Reset credentials for all potentially compromised accounts
- Block identified command-and-control infrastructure
- Engage cyber insurance carrier and legal counsel
First 24 Hours:
- Determine if data exfiltration occurred (impacts notification obligations)
- Assess backup integrity and restoration timeline
- Begin forensic analysis to determine root cause
- Initiate regulatory notification process if required
Looking Forward: 2026 Threat Predictions Based on This Week’s Data
Trend 1: Volume Over Value Intensifies
With payment rates declining throughout 2025, expect:
- 60-80 additional new groups emerging in 2026
- Continued pressure toward higher attack volumes
- Even shorter encryption-to-extortion timelines
- More “spray and pray” tactics targeting SMBs
Trend 2: AI-Enhanced Operations Scale
Groups already using AI tools will expand capabilities:
- AI-generated phishing content becoming indistinguishable from legitimate communications
- Automated vulnerability discovery and exploitation at scale
- AI-powered negotiation chatbots handling multiple victims simultaneously
- Deepfake voice/video used in initial access (vishing attacks)
Trend 3: Data Theft Becomes Primary Tactic
Beyond encryption + data theft, the shift continues:
- Encryption may become optional for many attacks
- Pure data exfiltration and extortion
- Silent breaches with delayed disclosure
- Focus on reputation damage over operational disruption
Trend 4: Cloud-Native Ransomware
Following patterns like the Codefinger AWS attacks:
- Exploitation of cloud platform native encryption features
- Credential-based attacks appearing as legitimate administrative activity
- Multi-cloud targeting across AWS, Azure, Google Cloud
- SaaS application ransomware
Trend 5: Critical Infrastructure Escalation
INC Ransom’s playbook of targeting “off-limits” sectors will spread:
- More attacks on emergency services and 911 systems
- Water treatment and power grid targeting
- K-12 education becoming primary target
- Municipal governments facing coordinated campaigns
Regulatory and Legal Landscape Evolution
Emerging Requirements
SEC Cybersecurity Disclosure Rules (2024):
- Material incidents must be disclosed within 4 business days
- Annual cybersecurity risk management reporting
- Board oversight disclosure requirements
State-Level Innovation: Multiple states considering or implementing:
- Ransom payment prohibition (limited success)
- Mandatory cybersecurity insurance
- Critical infrastructure protection requirements
- Data breach notification acceleration
Insurance Market Dynamics
2024 Trends Impacting 2025:
- Premium increases of 20-40% for organizations with prior incidents
- Stricter underwriting requirements (MFA, EDR, backup testing)
- Sub-limits on ransomware coverage
- Exclusions for “acts of war” (nation-state attribution)
Conclusion: This Week’s Message for 2026
The 348 ransomware and data breach incidents captured between December 12-19, 2025, represent far more than another busy week in cybersecurity monitoring. This seven-day snapshot demonstrates the complete maturation of cyber extortion from opportunistic crime to industrialized business operation.
Three critical insights from this week’s data:
Operational Tempo Is Permanent SAFEPAY’s 24-hour encryption timeline, Qilin’s precision targeting, and the sheer volume of simultaneous campaigns prove that year-round pressure is the new normal. The holiday slowdown is dead — buried by economic necessity and operational sophistication.
Economic Model Evolved Despite record attack volumes, payment rates have dropped to historic lows. Groups compensate through volume and data theft-focused extortion rather than encryption. The business model has adapted, not failed.
Target Selection Refined The consistent focus on $10M-$250M revenue organizations with hybrid IT infrastructure, limited security resources, and operational continuity requirements shows attackers have optimized victim selection to maximize ROI while minimizing law enforcement attention.
Looking Ahead to 2026:
This week’s patterns suggest what organizations should expect in the coming year:
- Continued high-volume operations regardless of season or holidays
- Increased focus on data theft over encryption as primary leverage
- More supply chain attacks exploiting trusted software
- Growing sophistication in initial access techniques
- Potential for insider threats even from cybersecurity professionals
For defenders entering 2026: ransomware is not a problem to be solved but a persistent business risk to be managed through continuous investment in prevention, detection, and response capabilities. Organizations still treating cybersecurity as a compliance checkbox will continue filling incident reports.
This week’s data shows us where we are. The 348 organizations compromised this week learned that lesson the expensive way.
For real-time threat intelligence and breach analysis, visit Breached.company — tracking the evolving ransomware landscape as it happens.
Appendix A: Dataset Methodology
Data Sources:
- Feedly cyber attack monitoring agent
- Ransomware.live leak site tracking
- Public breach notifications
- Security vendor threat intelligence reports
Coverage Period: December 12, 2024 00:00 UTC - December 19, 2024 23:59 UTC
Incident Criteria:
- Confirmed ransomware encryption or data theft
- Public acknowledgment via leak site or victim notification
- Sufficient detail to classify industry and geography
Limitations:
- Victim organizations may not be publicly disclosed
- Attack dates vs. disclosure dates create timing lag
- Some incidents may span multiple days
- Private negotiations may resolve without public knowledge
Appendix B: Threat Actor Profiles
SAFEPAY
First Observed: September 2024 Operational Model: Independent (non-RaaS) Primary Targets: Professional services, manufacturing, healthcare Geographic Focus: US (39%), Germany (30%), UK (18%) Encryption Timeline: 24 hours initial access to ransom demand Notable Tactics: ShareFinder.ps1, dual-channel communications, rapid-fire campaigns
Incransom (INC Ransom)
First Observed: 2023 Operational Model: Unknown (likely RaaS) Primary Targets: Healthcare, real estate, technology Notable Attacks: Singular Genomics (20TB data) Typical Data Volume: 500GB - 20TB
Qilin
First Observed: 2022 Operational Model: RaaS Primary Targets: Hospitality, beverage, retail Ransom Range: $50,000 - $50,000,000 Notable Tactic: Screenshot evidence releases before full extortion
Sinobi
First Observed: 2024 Operational Model: Unknown Primary Targets: Manufacturing, healthcare, financial services Geographic Focus: Emerging, primarily US-based Attack Volume: Lower frequency, possibly testing operations
Appendix C: Recommendations by Organization Size
Small Organizations (<$25M Revenue)
Priority 1: Basic Hygiene
- Implement MFA on all accounts
- Deploy managed endpoint detection and response (EDR)
- Contract with managed security service provider (MSSP)
- Implement basic backup with off-site storage
Budget Allocation:
- 3-5% of IT budget to security
- $25,000-$75,000 annually for basic protection
Mid-Sized Organizations ($25M-$250M)
Priority 1: Detection & Response
- 24/7 security operations center (outsourced acceptable)
- Advanced threat detection with behavioral analytics
- Incident response retainer
- Tabletop exercises quarterly
Priority 2: Architecture
- Network segmentation
- Privileged access management
- Zero-trust network implementation
- Air-gapped backup infrastructure
Budget Allocation:
- 5-8% of IT budget to security
- $200,000-$1,000,000 annually
Large Organizations (>$250M)
Priority 1: Advanced Capabilities
- Threat intelligence integration
- Purple team exercises
- Deception technology deployment
- Automated response orchestration
Priority 2: Resilience
- Business continuity planning with cyber scenarios
- Supply chain security requirements
- Board-level cybersecurity governance
- Regular independent assessments
Budget Allocation:
- 8-12% of IT budget to security
- $2,000,000+ annually
Report compiled December 19, 2025 Analysis based on 348 confirmed cyber incidents from December 12-19, 2025 Data sources: Feedly cyber attack monitoring, public breach notifications, threat intelligence platforms